The Sixth Snow Science Winter School in Col du Lautaret, France

Henning Lowe (SLF) inspects a 2.60m snow pit on the morning of day one.

Henning Lowe (SLF) inspects a 2.60m snow pit on the morning of day one.

Snow is a complex material. Initially made of individual snowflakes, it rapidly forms one huge, layered and interconnected ice structure as the flakes bond together upon landing. The long limbs of the crystals mean that the resulting structure consists as much of air as it does ice.

This property makes snow into a porous material, allowing water vapor to flow around it. These structures and flows form the basis of snow science. Snow scientists use these principles to study mountain avalanches, hydrology, polar ecology and climate; once a year grad students from these fields gather for the Winter Snow Science School.

Funded by the Finnish Meteorological Institute, the Swiss Avalanche Research Institute and the French Weather Service, the week long school brings twenty-four grad students into the mountains for a crash course on measurement, modeling and remote sensing of snow. This year the school was based out of the University of Grenoble’s 2100m high research facility at Col du Lautaret in the French alps.

Zac Provant (U. Oregon) records the temperature profile in a snow pit

Zac Provant (U. Oregon) records the temperature profile in a snow pit

Most of the course is based in the field, split into an independent project (two days) or practical instruction from lecturers (two mornings). The rest of the week was filled with lectures and data-analysis.

On the first morning of the school we were in the field digging snow pits and describing what we found. Tuesday morning featured rotating bases run by the school’s lecturers. Each base had its own snow measurement and associated instruments: snow surface area with infrared reflectance; snow density and hardness with the Swiss ramsonde and the snow micropenetrometer (SMP); snow water equivalent measurement with density cutters and a total-SWE tube; density measurements with capacitance based instruments like a Denoth-meter; traditional profiling with grain-card and hand-lens; and a theoretical base calculating the specific surface area of different grain-like shapes.

On Wednesday and Thursday we spent all day in the field, first at a forested site and then at a more exposed site. Split into groups of four, each team was given a different investigation to carry out. Our task was to characterize the snow structure at both sites and compare it with the output of the French met-office model, CROCUS.

 
My team about to fill in our pit on the final field day.

My team about to fill in our pit on the final field day.

 
Anna Karpova (SLF) weighing a snow sample in cold conditions

Anna Karpova (SLF) weighing a snow sample in cold conditions

On the first day we experienced persistent falling and blowing snow, which meant that we had to periodically re-dig our pit and clean its wall. Our approach was to work fast and use all the methods listed in the previous paragraph, which we succeeded in doing (and also took some infrared photographs). Fortunately the second day had clear skies and we were in the sun by lunchtime. Because we worked more quickly as a team having practiced the day before, the mood was much more relaxed and we finished early.

After each field day we were given one or two lectures before dinner. Topics included: Arctic snow; the IPCC special report on Oceans and Cryosphere; snow microphysics; mountain snow in a changing climate; optical and microwave remote sensing; and snow-forest interactions.

Somebody has to sit and write down all the measurements, even when it’s cold and snowing.Photo: Marie Dumont

Somebody has to sit and write down all the measurements, even when it’s cold and snowing.

Photo: Marie Dumont

On Friday we spent the day cleaning and analysing the data we’d collected on Wednesday and Thursday, and then presenting our results to the rest of the school. In addition to our model-comparison project, other projects focused on horizontal variability of key snow parameters and uncovering the history of the pit before comparison to weather data. We were finished by 3pm, in time for a group trip to the local spa - a very European experience. Then, suitably recovered after a tough week of information cramming and snow pit digging, we had a celebratory final night dinner.

From my perspective the school was a great success this year; I certainly enjoyed it and learned a lot. It was expertly planned and run by Marie Dumont and Neige Callone, and taught by Samuel Morin, Fabian Wolfsperger, Michaela Teich, Anna Kontu, Henning Lowe and Alex Langlois.

Growing Sea Ice Hundreds of Miles from the Sea

In February I travelled to the University of Manitoba’s Sea Ice Environmental Research Facility (SERF) with CPOM post-doc Rosemary Willatt to help with an experiment. The centerpiece of SERF is a eighteen meter long, concrete tank set into the ground. Looking a bit like an outdoor swimming pool, it’s filled with saltwater and surrounded by high-tech instruments. Winter temperatures at SERF regularly drop to -25°C, creating a covering of ‘artificial’ sea ice hundreds of miles from the sea itself.

 
Sunset at SERF. Two radar instruments overlook the tank and take automated measurements every eight minutes.

Sunset at SERF. Two radar instruments overlook the tank and take automated measurements every eight minutes.

 
The view from the SERF office of a high-tech radar and a low-tech human. Photo: Rosemary Willatt

The view from the SERF office of a high-tech radar and a low-tech human. Photo: Rosemary Willatt

Ice that forms from seawater is different to the stuff that forms on lakes. When seawater turns to ice, the salt that was previously dissolved is mostly rejected from the structure in the form of super-salty brine. Some remains in millimetre-sized pockets within the ice structure, but most streams out the bottom or sits on top. This brine fundamentally changes the physical and electromagnetic properties of the ice. Scientists wanting to study the properties of sea ice must therefore grow it from saltwater, which requires very low, sustained temperatures.

This winter’s main SERF experiment focused on the snowpack that accumulates on top of sea ice. When it snows (and it always eventually snows), the cold snow soaks up some of the upward-rejected brine like a sponge. The height that the brine reaches in the snow is poorly understood, posing a problem for scientists interested in measuring sea ice thickness from space.

Scientists currently estimate sea ice thickness by using radar waves that are often assumed to penetrate the snow and bounce off the underlying ice surface. However, it’s also increasingly accepted that these radar waves won’t penetrate through brine-soaked snow, so if brine is present in the snow then our historical assumptions won’t hold. Where radar waves bounce off the briney-snow layer before making it to the ice, we measure the sea ice to be thicker than it really is. Understanding the height that brine reaches in the snow would be a big step towards improving our satellite-derived estimates of sea ice thickness.

 
Snow falls in large, highly complex shapes. The grains we saw sometimes exceeded 5mm in diameter, making them extremely difficult to model.

Snow falls in large, highly complex shapes. The grains we saw sometimes exceeded 5mm in diameter, making them extremely difficult to model.


Sampling the surface of the ice with a chisel. Photo: Rosemary Willatt, CPOM UCL.

Sampling the surface of the ice with a chisel. Photo: Rosemary Willatt, CPOM UCL.

At SERF Rosie and I sampled and observed the snow cover and ice surface twice a day when it wasn’t snowing. When it snowed three days into the experiment, we sampled the snow every hour. Every two days we would drill an ice-core to measure the ice thickness and sample the full extent of the ice. By the end of the ten day experiment we’d collected more than a hundred samples, which we then took to the lab for salinity analysis.

While Rosie and I focused on our physical sampling program, Dustin Isleifson and Chris Fuller from University of Manitoba monitored the ice using radars similar to those carried on satellites. A third team made up of David Landry and Maddie Harasyn scanned the snow surface with a drone-mounted lidar. Our task is now to establish how the directly measured changes in the snow translate to what Dustin and Chris recorded with the radars and what David and Maddie scanned with the drone. Hopefully we can use the data to improve our understanding of what satellites like CryoSat-2 or Sentinel-3 are seeing from space when they’re pointed at the sea ice.

Rosie drills an ice core near the edge of the tank.

Rosie drills an ice core near the edge of the tank.

As well helping run the experiment, Rosie and I used our time in Canada to discuss our science and build collaboration with colleagues at the Centre for Earth Observation Science at UoM. The whole department was incredibly welcoming and friendly to us, with the scientists keen to show us around Winnipeg. By all accounts Rosie gave an excellent talk on her research, which sadly I had to sleep through after being up all night sampling the snow. As well as making Winnipeg feel like home for two weeks, Chris Fuller taught Rosie and me a lot about snow and ice sampling techniques and was always on hand to answer our questions. We’re now back in comparatively warm London and ready for some data analysis!

 
Chris Fuller downloads data from the C-band radar instrument.

Chris Fuller downloads data from the C-band radar instrument.


Learning on the Job – UK graduate students join the largest Arctic expedition in history.

This post was written for the NERC Arctic Office Blog

In the twilight-zone, three hundred miles from the North Pole, you don’t take your gloves off without a good reason. My fingers ached as I ran them through the powdery snow, feeling for the hard, stainless-steel bolt that I’d just dropped. The light was fading as we built a small wind-turbine, designed to power a suite of instruments as they operate autonomously for the next year on the floating sea ice.

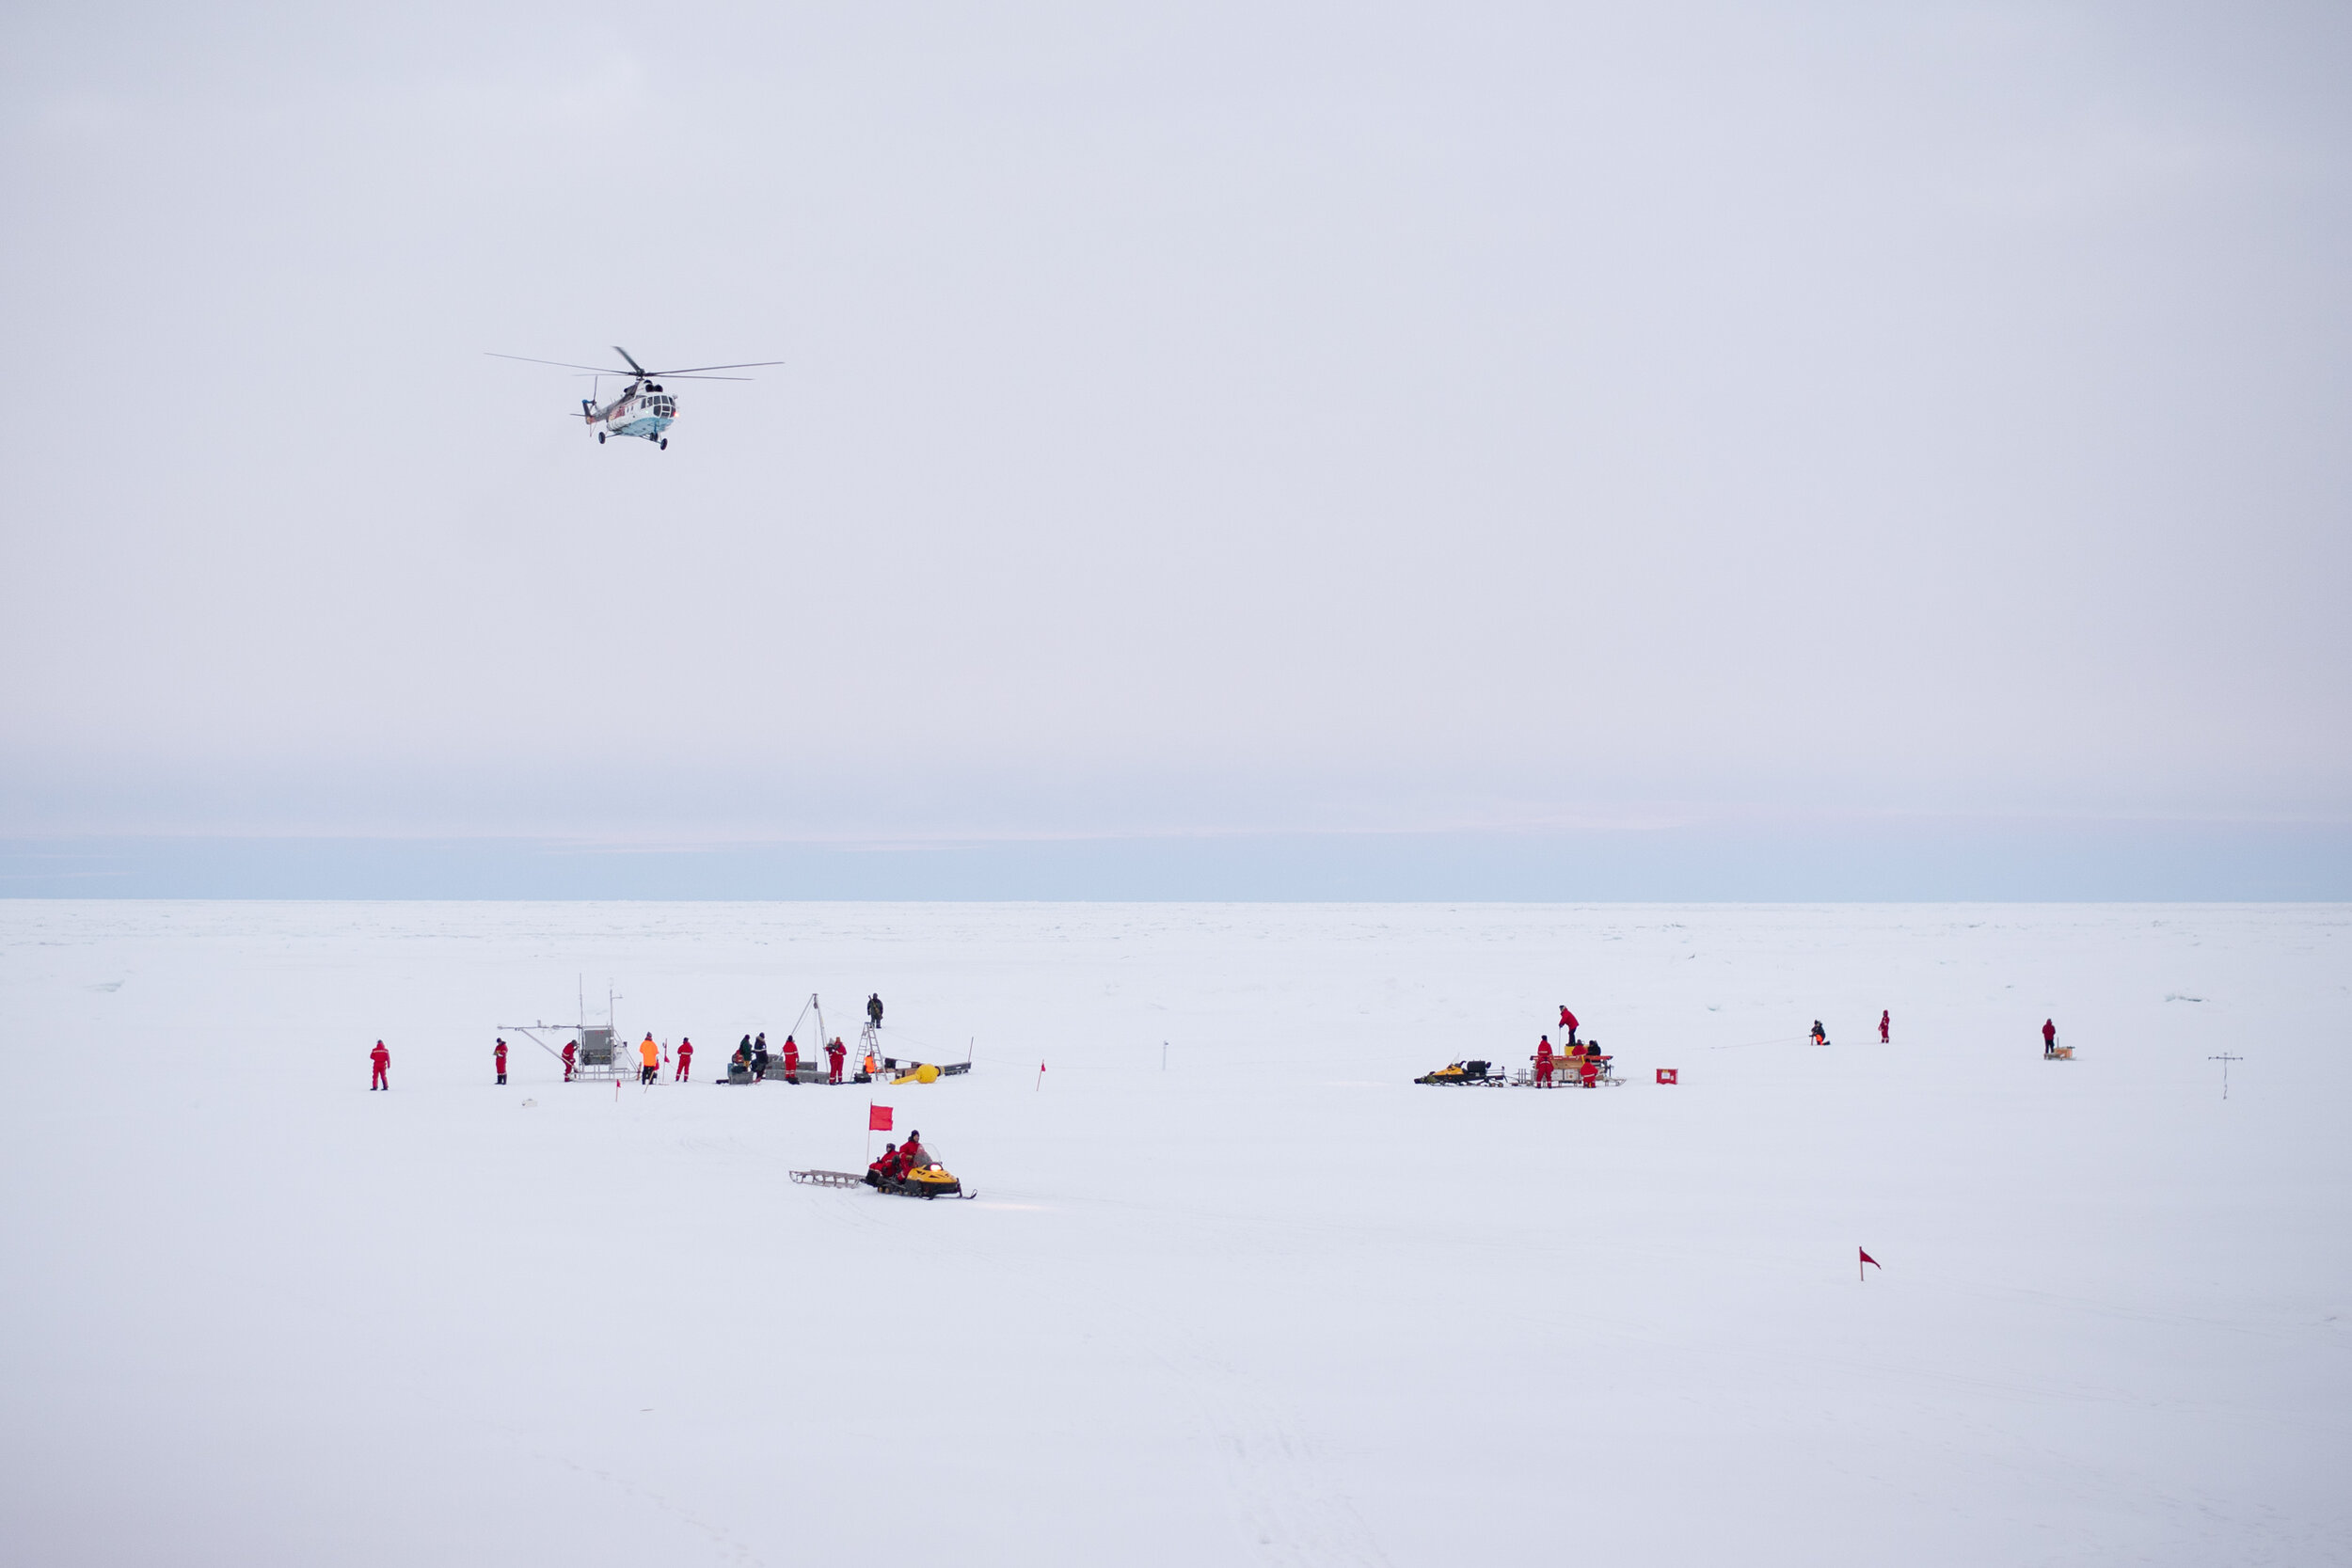
A Russian Mi-8 helicopter returns from a remote deployment as scientists work below. Photo by Sam Cornish.

A Russian Mi-8 helicopter returns from a remote deployment as scientists work below. Photo by Sam Cornish.

We were building the turbine as part of the MOSAiC Expedition, a vast international push to uncover the scientific secrets of the Arctic Ocean in its months of darkness. Over the next year more than six hundred scientists will take shifts on the German icebreaker Polarstern as it drifts past the North Pole, frozen into the pack ice. It will form the basis of the Multidisciplinary drifting Observatory for the Study of Arctic Climate – MOSAiC for short. Spread out for miles around the ship are hundreds of hi-tech sensors which will monitor their environment and relay data via satellite link.

An armed polar bear guard keeps watch from a section of rough ice. On that day the sun would not appear above the horizon, leaving only a few hours of orange light to work in. Photo by Sam Cornish.

An armed polar bear guard keeps watch from a section of rough ice. On that day the sun would not appear above the horizon, leaving only a few hours of orange light to work in. Photo by Sam Cornish.

In the early stages of MOSAiC’s planning it was decided to include a group of twenty graduate students in the setup-phase. I was one of two selected from the UK, the other was Sam Cornish, a physical oceanographer from the University of Oxford. As well as helping deploy the instruments on the sea ice, Sam and I participated in an extended workshop on the Arctic climate system while in transit to and from the ice.

The workshop (known as “MOSAiC School”) was a once-in-a-lifetime experience for its participants. While travelling in convoy with Polarstern on board Russian icebreaker Akademik Fedorov, we were taught by top scientists researching the full gamut of Arctic climate processes. Where time and weather allowed, scientists were even helicoptered in from Polarstern to talk.

Scientists peer down at the fractured ice as Fedorov and Polarstern rendezvous to exchange equipment and personnel. Photo by Sam Cornish.

Scientists peer down at the fractured ice as Fedorov and Polarstern rendezvous to exchange equipment and personnel. Photo by Sam Cornish.

The team on board Fedorov spent 24 days of its 38 day expedition in the sea ice, deploying 106 sensors at 64 sites in temperatures as low as -25C. On some days the sun would not appear above the horizon, but instead would provide a rotating display of breathtaking sunset tones for hours at a time. Perhaps even more than the sunsets, I’ll remember the extraordinary group of graduate students who helped make the school and the expedition such a success.

Finally, I’m grateful to those near the top of the MOSAiC expedition for ensuring that graduate students like me could be involved via the Association of Polar Early Career Scientists (APECS). Special thanks to Dr. Tim Stanton who, on top of permanently advocating for our involvment, also found a spare bolt for the wind-turbine.

Written by Robbie Mallett with photographs from Sam Cornish.

So you don’t want to be attacked by a polar bear: Flares and firearms in the field

By Robbie Mallett and Sophie Watson

This blog informally documents the advice given in Ny-Ålesund and is not written as formal guidance for those planning fieldwork. It is written by PhD students to provide insight, and is no substitute for qualified advice and training!

Polar_Bear_-_Alaska_%28cropped%29.jpg

We were lucky enough to be among ten polar science PhD students who recently travelled to Svalbard with the British Antarctic Survey for a course on safe and effective polar fieldwork. We had an amazing time on land and at sea, but throughout all our work we had to remain constantly vigilant for polar bears. Mitigating the risk of a bear attack involved learning about polar bear behaviour and training with flare guns and rifles. Here’s a summary of how we learned to stay safe in bear country!

Why are polar bears dangerous?

There are thought to be around three thousand polar bears on the Svalbard islands; that’s more polar bears than there are humans. As the largest of all bear species, adult males weigh around 500 kg, but one (nightmare-inducing) specimen killed in Alaska weighed just over a tonne - landing it straight into the Guinness book of animal world records. 

record_bear.jpg

Polar bears are fast runners over short distances and are also very capable hunters under-water. They can run up to 40kph (faster than the 100m sprint world record) and swim at up to 6.2kph (faster than the 50m freestyle world record). As the most carnivorous extant bear, polar bear teeth are pointier and sharper than their omnivore bear buddies. They also have huge paws, adapted for swimming and walking on ice. 

Polar bears don't defend territories largely because their ranges are so huge - they occupy areas of tens of thousands of square kilometers. Despite this, they are notoriously defensive around their cubs or when inadequately fed. With recent, rapid decline in sea-ice extent and a subsequent increase in human-polar bear interactions, bear attacks have increased in frequency and will likely continue to rise

How to avoid polar bears? 

  • Avoid areas of restricted visibility.

Low cloud and steep terrain can allow you to approach a polar bear without you or the bear realising. A surprised bear is usually an unhappy bear - and you probably won’t be too pleased about it either. Avoid travelling in poor visibility and plan your route to minimise moraine fields. Avoid tight corners of buildings too - if you must approach, give obstacles a wide berth. 

  • Minimise time spent by the beach (you won’t tan anyway) 

Polar bears hunt at the interface of land, water and ice. As such, they’re more commonly found around beaches. Camping on beaches should particularly be avoided. 

“Bear canisters” reduce but do not eliminate the risk of attracting bears with food odours.

“Bear canisters” reduce but do not eliminate the risk of attracting bears with food odours.

  • Seal your food when camping

Bears spend most of their waking hours searching for food and have an excellent sense of smell, which works on the scale of several kilometers. If they smell food in your camp or your rucksack, they’ll come after it! Special containers such as ‘bear canisters’ are available to buy. Food/canisters should be hung 50m from any camping area. 

  • Always have a spotter

Dedicate a member of your team to watching for bears and equip them with binoculars. This team member should avoid being distracted and should feel confident to stop the group periodically to scan the landscape (you can’t walk and use binoculars safely). 

  • Work in large groups

A 2017 study found that nearly all polar bear attacks recorded between 1870-2014 involved 2 people or less. It is wise to work in larger/more intimidating sized groups where possible, but make sure team members stay grouped close together. If you need a wee while out on fieldwork, don’t venture far from the group and definitely don’t go out of sight. 

How to deal with an encounter?

  • Leave the area

This is by far the best tactic. Remember, polar bears are protected by Svalbard law and should only be interfered with in extreme circumstances! Hefty fines are given to those who don’t adhere to the rules. All other things equal, move to an area of higher, more open ground or, if possible, get inside a building. In Ny-Ålesund almost all outer doors for buildings are left unlocked for this exact reason. But remember - never turn your back on a polar bear and remain vigilant. 

  • Tell others

There are possibly other groups in the area who don’t know about the bear. Use your radio or satellite phone to warn other teams and bases - consider marking your position on your GPS too. Once you are safe, let your base leader know! 

  • Use your flare gun at close range

Polar bears are not known to run long distances, so will only break into a run when they’re at close range. If you feel your safety is immediately at risk, you can scare the bear by using a flare gun. Remember that if you fire your flare gun and it explodes behind the bear, it might flee towards you - this is bad.

Always consider what lies behind the bear and ensure your team is safely behind you. Typically, flares can be deployed if the polar bear is still showing interest in you and your team at about 50m (but you need to judge the situation and your own comfort level yourself). Before leaving base, your entire team should know who in the group is carrying a flare gun. 

  • Be big and loud

If you do not have a firearm and the bear is deliberately moving towards you, undo your jacket to make yourself seem bigger and scare it with shouting.

  • If the bear is charging, shoot at close range

At close range (~25m), you may be able to hit the bear with your rifle. This should be done in the neck directly behind the head as it comes towards you. You are aiming for the spinal column. If you hit it and it falls down, shoot again as bullets are known to non-lethally strike the spine and skull at low angles. If you engage a bear with a firearm you must inform the Svalbard governor's office immediately.

Other Safety Points

Robbie half-loading a rifle at the edge of the Ny-Ålesund safe zone. Photo: Aurelia Reichardt (BAS)

Robbie half-loading a rifle at the edge of the Ny-Ålesund safe zone. Photo: Aurelia Reichardt (BAS)

  • Half loading your rifle

Carrying a fully loaded rifle is extremely dangerous. The ‘safety catch’ is often not used by convention and fully loaded rifles are liable to fire at any time. They are therefore carried ‘half loaded’ during normal scientific operation - this involves fully inserting the bolt into the empty chamber. The gun should only be cocked if there is an immediate risk of polar bear attack.

  • Shooting to Kill

Bears should only be shot at when they are a direct threat to you, and as such should be mostly shot at head-on. In this position, the rifle should be aimed just above the head, allowing for a vertical margin of error. If in the side-on position (in the case where a bear is attacking another person), they should be shot in the body to the rear of the shoulder of the front leg. This maximises the chance of a fatal injury to the bear’s internal organs. Ideally you want to hit the heart, as a bear has been known to still charge with a lung injury.

  • Extra Risk Factors

There are some risk factors that make bears more dangerous than usual. 

Hungry Bears

Bears are particularly lean and hungry at the end of summer and therefore pose the most risk to humans in an encounter. They are also often forced onto land and near populated areas in this period due to seasonal sea ice retreat.

Sleepy Bears

Bears woken from sleep are anecdotally dangerous. You can minimise the chance of waking a sleeping bear by staying in open terrain with high visibility. 

Mother Bears

Bears are significantly more aggressive when defending cubs. When encountering a bear, consider the potential presence of another (even more dangerous) bear and be wary of developing tunnel vision.

Further Reading

The INTERACT fieldwork planning handbook is an excellent first reference for safety protocols in polar bear country.

The University of Copenhagen also has a Safety Manual for Arctic Fieldwork with a more comprehensive appendix on polar bear safety.

The University Centre in Svalbard (UNIS) firearms policy has good advice on rifle safety including transport and half-loading protocols.

Polar Bear Attacks on Humans: Implications of a Changing Climate.Wildlife Society Bulletin, 41(3), pp.537-547. Wilder, J.M., Vongraven, D., Atwood, T., Hansen, B., Jessen, A., Kochnev, A., York, G., Vallender, R., Hedman, D. and Gibbons, M., 2017. Polar bear attacks on humans: Implications of a changing climate.

Sophie_Watson.jpg

Sophie Watson

Sophie Watson is a PhD student at Cardiff University School of Biosciences.

Her project investigates how the gut microbiota of polar bears and wolverines are influenced by changing climatic and anthropogenic stressors, including changes in land use, parasite diversity/load and contaminant accumulation.

Sophie tweets @watsonse1

mallett_robbie.jpg

Robbie Mallett

Robbie Mallett is a PhD student at the Center for Polar Observation and Modelling at University College London.

His work concerns the distribution and impact of snow on Arctic sea ice, particularly with respect to measurements of sea ice thickness from space

Robbie tweets @robbiemallett

MOSAiC: A Year-Long City on Sea Ice

The Arctic Ocean is complicated, important and undergoing rapid climate change. As the sea ice thins and retreats, sunlight and Arctic winds are warming and stirring the ocean in an unprecedented way. This has serious implications for regional ecosystems, northern hemisphere weather and global climate.

Today I leave for the shrinking ice aboard Russian icebreaker Akademik Federov to help build part of a “city on ice”. The formal name for the city is the Multidisciplinary Observatory for the Study of Arctic Climate - MOSAiC for short. Its “downtown” will be the German research vessel RV Polarstern.

German icebreaker RV Polarstern will form the centerpiece of the drifting climate observatory.

Stacked full of food, fuel and scientists, Polarstern will be deliberately frozen into the sea ice for a full year in order to monitor the environment.

Surrounding the ship will be the largest array of technical instruments ever assembled on the sea ice in a historic, multimillion pound, multinational research endeavour.

MOSAiC has taken most of a decade to plan and prepare for. It represents the largest expedition to the central Arctic in history (by some margin!)

I’ll help set up and deploy these instruments and also participate in perhaps the greatest graduate summer school ever conceived: twenty PhD students will live, work and learn alongside science journalists and communicators, thrashing out the details of the Arctic climate system with the help of the MOSAiC scientists. But freezing a ship into the ice for a year isn’t easy or cheap. It requires an enormous amount of planning and money: 600 scientists from 19 countries will contribute to the 390 day expedition at a cost of more than €140m. So why bother?

We need to do this because the Arctic is the epicenter of climate change. Due to a phenomenon known as Arctic amplification, the region has seen a rise in temperature unparalleled anywhere else on the globe.

This shocking rise is forecast to continue as the world warms over the next century. Given that the Arctic drives much of Northern Hemisphere weather and sets global temperatures through its high reflectivity, this change in climate is extremely concerning. To compound our concern, scientific uncertainty abounds in the Arctic. While all mainstream climate models predict an unparallelled warming in the Arctic, inadequate representation of sea ice and cloud physics leads to large variation between the models with respect to size of the change. 

Observed change of temperature 1970 – 2017 [Degrees C]. The Arctic region has experienced unparalleled warming in recent years.

Observed change of temperature 1970 – 2017 [Degrees C]. The Arctic region has experienced unparalleled warming in recent years.

The data taken during MOSAiC’s operation will change the face of Arctic climate science and hopefully radically reduce these uncertainties. My research into the properties of snow on sea ice will be propelled forward as the expedition generates insight into how the internal properties of the snow-pack evolve. The complex issue of Arctic clouds and boundary-layer processes will be tackled head-on with measurements never before taken in the central arctic. All these measurements will ultimately be fed back into climate models and improve our understanding and predictions of future climate change.

A MOSAiC researcher practices with a tethered weather observation balloon in Svalbard

Polar scientists now frequently refer to the “New Arctic” - one characterised by diminished sea ice which is starkly younger and thinner than before. Understanding the New Arctic may require a New Science, one that’s multidisciplinary and multinational; this what we hope MOSAiC will be.

For more information, you can visit www.mosaic-expedition.org

To track the expedition as it’s built and as it drifts, visit follow.mosaic-expedition.org/

To read even more, visit en.wikipedia.org/wiki/MOSAiC_Expedition (I wrote the original article!)

America’s next top modelers: two weeks of climate science at NCAR, Colorado.

At the Eastern foot of the Rocky mountains in Wyoming sits the town of Cheyenne, home to about sixty thousand people. Founded shortly after the civil war, its stereotype is one of hard-working middle-America. But if you take Highway 210 to the outskirts of town, you’ll find an inhabitant that redefines the concept of hard work: the fortieth most powerful supercomputer in the world.

Cheyenne was ranked as the 40th most powerful supercomputer in the world by TOP500 in June 2019.

Cheyenne was ranked as the 40th most powerful supercomputer in the world by TOP500 in June 2019.

The eponymous “Cheyenne” is maintained by the US National Center for Atmospheric Research (NCAR), and is almost exclusively used for running computer models of the climate system. Cheyenne is mostly controlled remotely via the internet by scientists in Boulder, Colorado, and often from the iconic Mesa Lab which overlooks the city from a picturesque mountain plateau. I was invited to the Mesa Lab for two weeks to learn about NCAR’s in-house climate model and run it on Cheyenne to study the polar climate system.

The Mesa Lab sits on a small plateau at the foot of the Rocky Mountains looking over Boulder

The Mesa Lab sits on a small plateau at the foot of the Rocky Mountains looking over Boulder

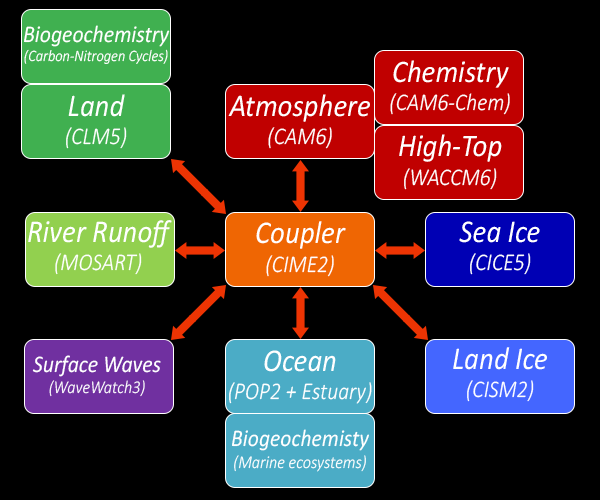
Modern study of the climate depends on modeling the different systems that define it (such as sea ice, forests and ocean biology). Climate scientists now talk about “earth system” models rather than just ‘climate models’ to reflect this complexity. My first week in Boulder would be dedicated to exploring one of these earth system models: CESM (the Community Earth System Model). CESM simulates seven systems and their interactions in around two million lines of code.

The case of full coupling between atmosphere, ocean, sea ice, land ice, waves and the land surface is extremely computationally expensive and rarely run by specialist groups such as mine at the Center for Polar Observation and Modelling. Instead, fully coupled runs are carried out centrally on supercomputers like Cheyenne and the results are uploaded onto online archives for analysis.

 
Schematic of the earth systems coupled together in CICE v2

Schematic of the earth systems coupled together in CICE v2


Rather than run CESM in “fully coupled” mode, most scientists run simplified “cases” of the model to study specific systems. For instance, you may not need to compute the distribution of ocean waves in a study of how volcanic eruptions affect ozone production in the upper atmosphere. In the first week I became familiar with running these simplified cases and examining the output. The mornings were generally taken up by lectures from expert modelers, and afternoons were spent running CESM in different configurations and with different settings.

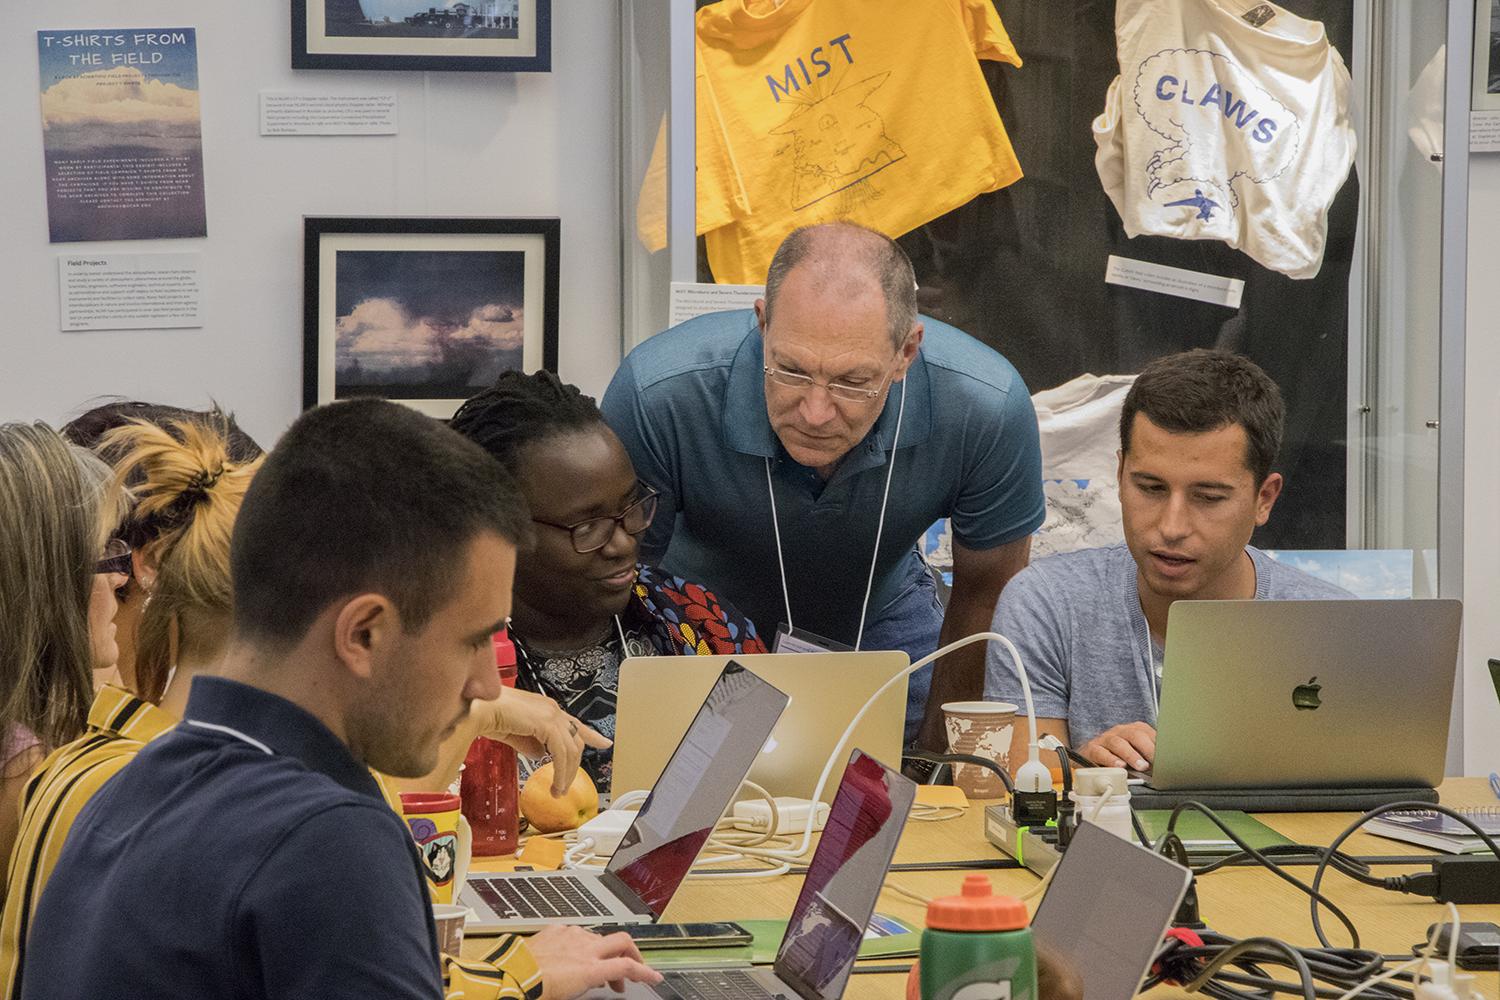
Keith Oleson helps tutorial students run CESM. Photo: @NCAR_CGD

Keith Oleson helps tutorial students run CESM. Photo: @NCAR_CGD

Week two was dedicated to modeling the polar climate system, and the attendees were reduced from around 80 to 20. We began week two by forming teams and making predictions for this year’s minimum area of Arctic sea ice. The week then ran with a similar format to the first. Exercises now included modifying the source code and running the model at different complexity levels to deduce the behavior of individual systems.

In the evenings we made the most of the Mesa Lab’s dramatic geography, hiking the mountains above us and walking back into town for late dinners. The generous per diem from the workshop’s organisers allowed us to eat out together most nights, discussing science and a lot else. During the middle weekend, some of us rented a car for more ambitious hikes and experienced Boulder’s wildly changeable weather first hand. One social highlight was being kindly invited to Marika Holland’s house for an evening of empanadas, conversation and corn-hole (British readers should google it).

An opportunistic evening hike up the Bear Creek trail. Photo: Adi Nalam

An opportunistic evening hike up the Bear Creek trail. Photo: Adi Nalam

Over the fortnight I went from a total climate modeling novice to a confident user of CESM. Looking at the notes I took, I can now happily modify the source code, design my own model runs and process the output. More broadly, I have a much better understanding of nuanced but important concepts like the role of internal variability and model hierarchies. What’s more, I made lots of great contacts with sea ice scientists and polar modelers and have plans to do some cool stuff with them in the near future!

As well as the course being free, my flights, accommodation and per diem were generously funded by NCAR and its Polar Climate Working Group, which are in turn sponsored by the US National Science Foundation.

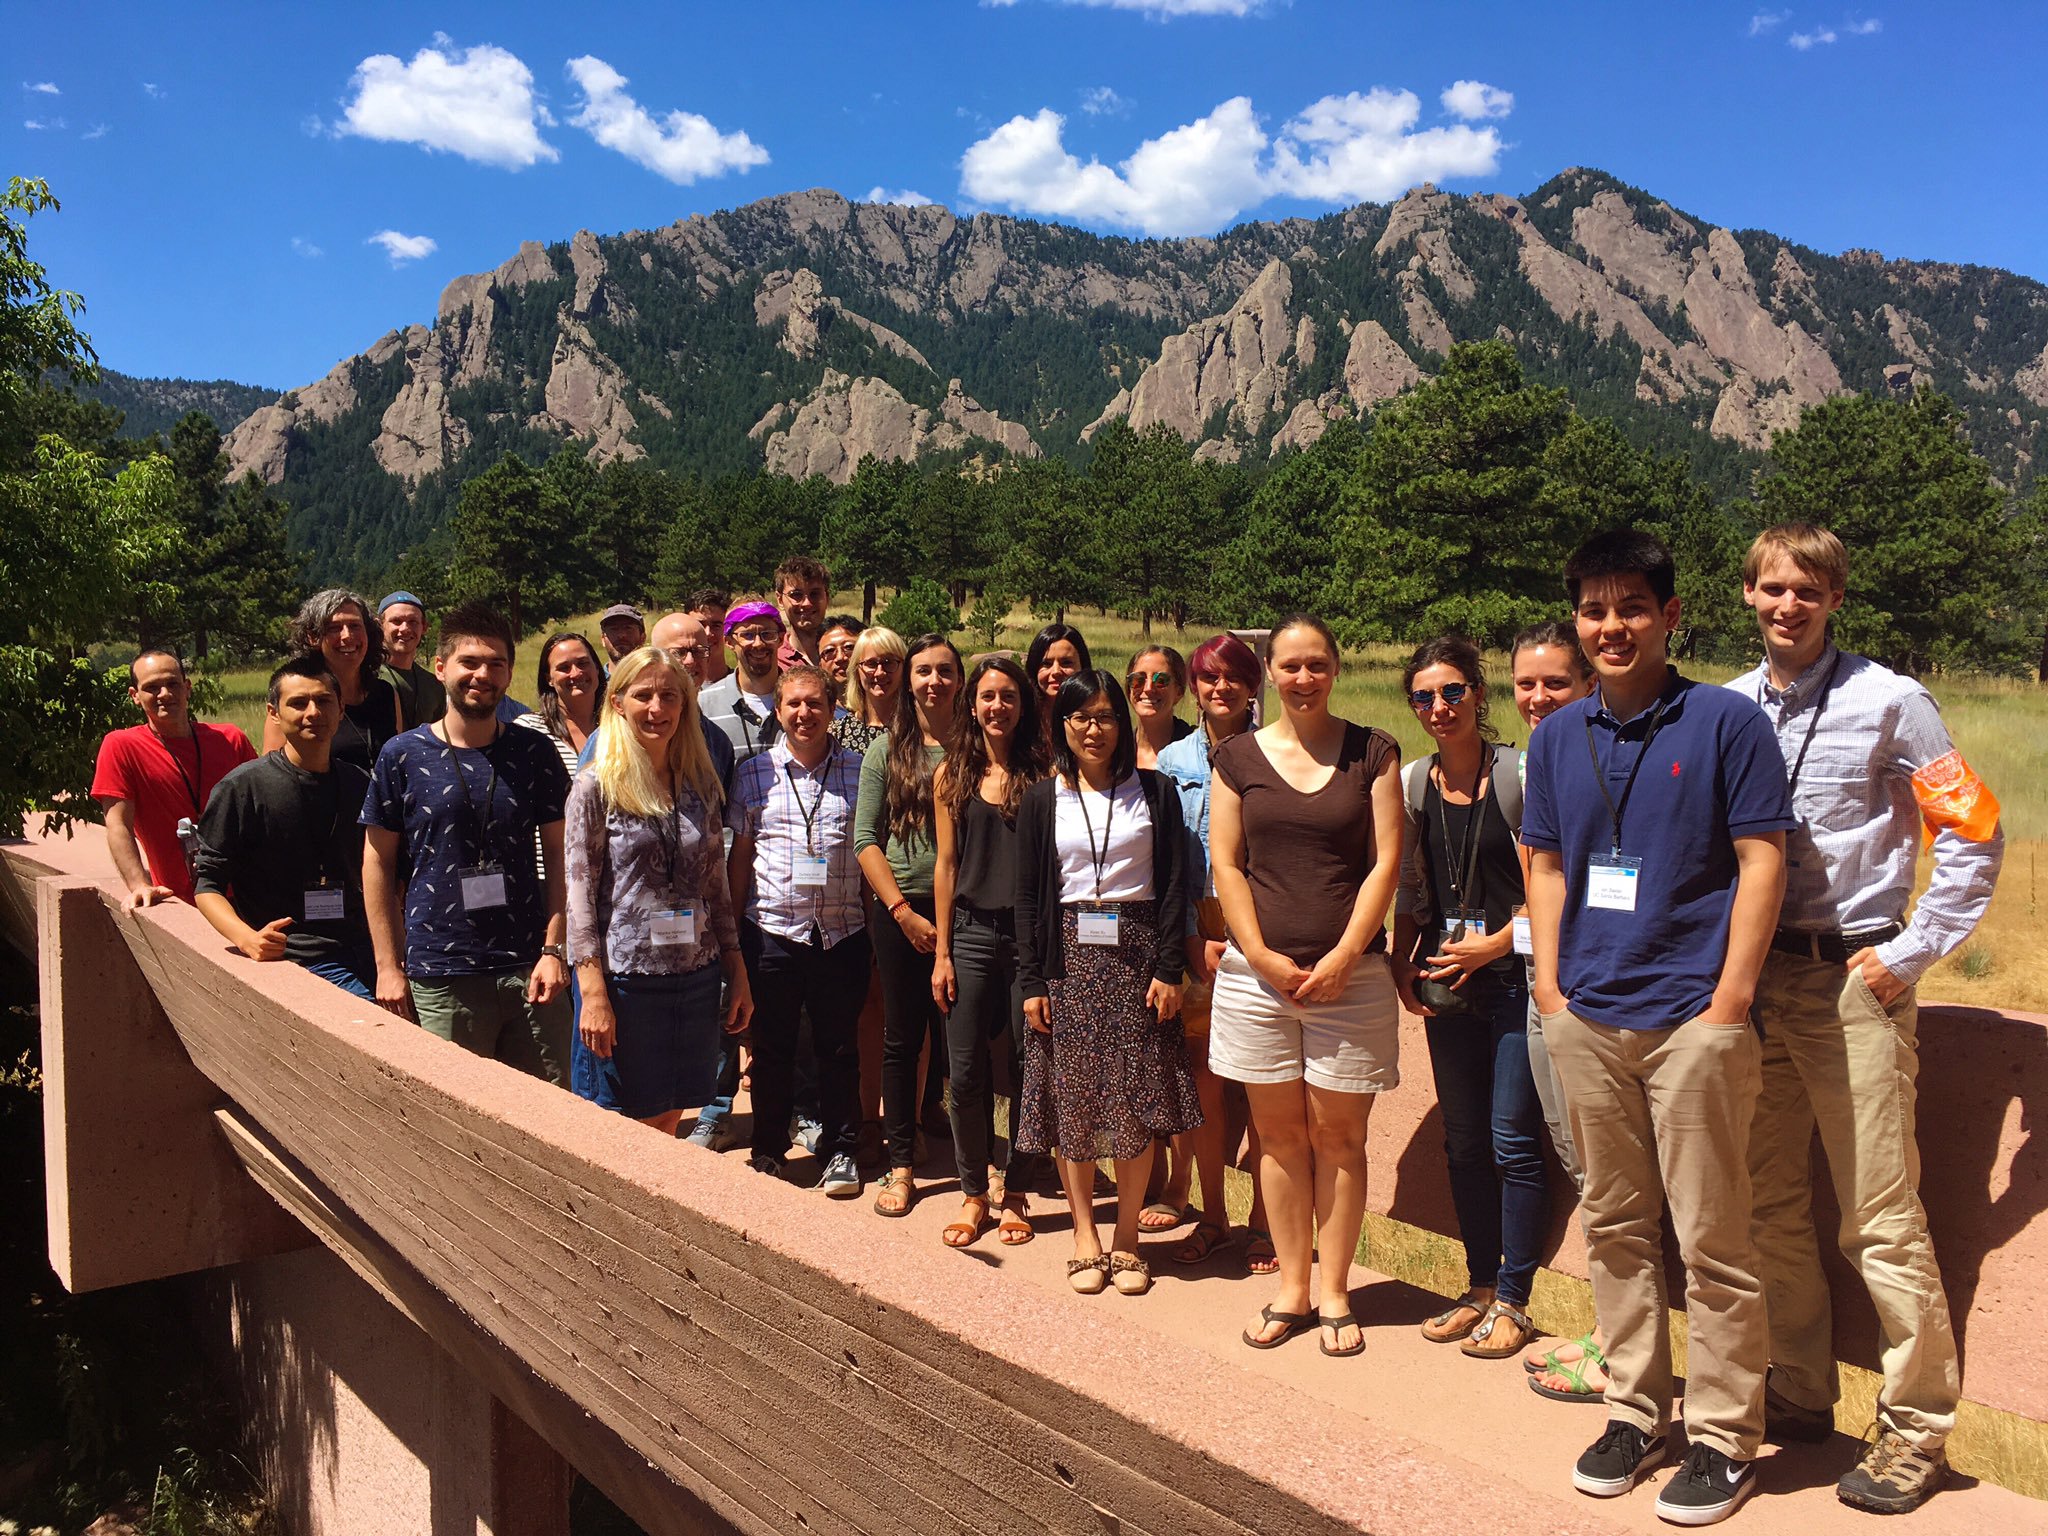
NCAR 2019 Polar Modeling Workshop participants and organizers. Photo: David Bailey/ Todd Amodeo

NCAR 2019 Polar Modeling Workshop participants and organizers. Photo: David Bailey/ Todd Amodeo

Lasers in space - NASA's ICESat-2 satellite counts photons from orbit

This week I attended a five day hack-week organised by the University of Washington Polar Science Center and the eScience institute, and taught by members of the NASA ICEsat-2 science team. The hack-week was made up of tutorials on data access and manipulation as well as collaborative projects on polar science.

group_photo.jpg

Light detection and ranging (Lidar) is nothing new in environmental science - it's used to map topography and vegetation in 3D and measure distances with extreme precision, helping scientists monitor systems from volcanic hazards to beach erosion.

But despite the heritage its the technology, NASA’s new ICEsat-2 satellite is a major leap forward, firing laser pulses at earth from low earth orbit and counting individual photons in as they return. By measuring their time of flight, it calculates elevations of the reflecting surfaces with centimetre accuracy. Even better, it does this with six laser beams, scanning a swath of terrain 9km wide. Each beam has a footprint of 17m diameter, offering unprecedented spatial resolution with a measurement every 70cm.

The six beams are divided into three pairs, with paired lasers 90m apart. This allows for measurements of gradient in the and 'across-track' directions, critical for steep and complex surfaces like glaciers.

poster.jpg

During the workshop we were quickly encouraged to pitch our ideas for projects, with attendees proposing ocean wave detection, mapping of ice sheet grounding lines and calculation of floe size distribution. I proposed a project to investigate the automatic blowing snow detection algorithm and was very pleased to have five people join my project! I wanted to compare the data to weather data from climate models, but we quickly branched out to mapping the distribution of blowing snow too.

We made a convincing climatology and our comparisons to reanalysis were encouraging, but we limited our scope to land-ice for practical reasons. We're now planning to extend our work to the ICEsat-2 sea ice product, where a climatology of blowing snow has never been made (to our knowledge).

Eric Keenan’s (@EricKeenanCU) plot of blowing snow optical depth over Antarctica. The optical thickness is higher over East Antarctica (figure right) in agreement with published work.

Eric Keenan’s (@EricKeenanCU) plot of blowing snow optical depth over Antarctica. The optical thickness is higher over East Antarctica (figure right) in agreement with published work.

A significant part of the week focussed on software tools like cloud computing in Jupyter Lab and Git, a collaboration and version control tool. It was great to be pushed to use these tools, as I wouldn't have done so otherwise. Git in particular offers our blowing snow team a chance to continue developing our product even now the hack-week is over.

As well as the chance for ongoing collaboration on blowing snow, ICEsat-2 has a lot to bring to my PhD project. I'm currently working on radar altimetry of the sea ice surface and encumbent assumptions about the spatial patterns of snow cover. ICEsat-2 offers the chance to validate radar altimetry, and also to shed light on model-generated snow distributions. During the hackweek I also had a couple of other ideas for novel uses of the data, which I'm going to keep under my hat for now! Perhaps just as valuably, I made some great connections with other PhD students with expertise in connected areas.

It clearly took a lot of time and effort to make this happen; thanks go in particular to the University of Washington eScience institute and Polar Science Center, and Anthony Arendt who brought it all together. I'm looking forward to all the icey science to follow!

Five days of Antarctic sea ice chat in Bern

Last week I joined twelve leading sea ice scientists at the International Space Science Institute (ISSI) in Bern for a meeting to discuss satellite measurements of Antarctic sea ice. ISSI offers generous support to young scientists like me to attend these meetings. But why is Antarctic sea ice so important but so difficult to measure by comparison to its Northern sibling?

Like that of the Arctic, Antarctic sea ice plays a key role in our climate. However, it’s chronically understudied, partly because nobody lives on Antarctica (apart from scientists). It also is less of a barrier to international shipping, a feature which motivates a significant chunk of Arctic sea ice research. Because of these reasons and others (discussed later), it’s relatively poorly understood.

While Arctic sea ice extent has declined sharply with global warming, Antarctic sea ice extent has slightly increased. Plot credit: Zeke Hausfather, Yale Climate Connections

While Arctic sea ice extent has declined sharply with global warming, Antarctic sea ice extent has slightly increased. Plot credit: Zeke Hausfather, Yale Climate Connections

Unlike the Arctic Ocean, which is a sea almost entirely surrounded by continents, the Southern Ocean surrounds its own continental island. Because of this shape and the fact that the island sits over the pole, winds and ocean currents can swirl unimpeded round the bottom of the earth. This swirling of air and water isolates frozen continent from many of earth’s atmospheric and oceanic processes, keeping it cool and partly shielding it from polar amplification. This shielding has even helped sea ice increase its spatial coverage with recent global warming. Even with this shielding, Southern sea ice has its own challenges to growth. Rather than sitting in a protected ocean, southern sea ice is free to float northwards into warmer water and melt, meaning that southern sea ice rarely survives a summer and is in general young and thin compared to northern sea ice.

Antarctic sea ice surrounds an island, whereas Arctic sea ice is largely enclosed by continents. Figure shows northern hemisphere summer sea ice extent, so Arctic sea ice coverage is anomalously low and Antarctic coverage is anomalously high. Figure…

Antarctic sea ice surrounds an island, whereas Arctic sea ice is largely enclosed by continents. Figure shows northern hemisphere summer sea ice extent, so Arctic sea ice coverage is anomalously low and Antarctic coverage is anomalously high. Figure credit: NASA Global Climate Change Blog

While we have a good idea how much area is covered by Antarctic sea ice (on average just less than Arctic sea ice at ~10 million square kilometres), data on its thickness is patchy at best. Because of this, we really don’t know how much sea ice actually exists around Antarctica. In the Arctic we can use radar from satellites to measure how much the ice protrudes out of the water, and from this work out how much ice is submerged. In contrast, in the Antarctic, the snow is often so thick that it weighs down the surface of the ice enough to totally submerge it. When this happens we can’t measure ice thickness directly. Adding to the difficulty, Arctic snow generally permits radar penetration and allows us to measure the ice surface. Antarctic snow is much more prone to reflecting satellite radar and so blocks direct measurment of the sea ice.

In fact, snow is regarded among scientists as the major barrier to a thorough understanding of Antarctic sea ice thickness. Its depth, density and microscopic properties affect both our view of the ice from satellites and the processes that form and melt of the ice itself. Scientists are yet to develop a “snow map” for the Antarctic sea ice, a source of consternation for those wanting to study the ice below.

Despite these barriers to research, a full understanding Antarctic sea ice processes is an attractive prize. Our ability to model and predict the climate depends on our estimation of the fresh-water locked up in sea ice each winter. Extremely salty water is rejected from the ice as it freezes and drives global ocean circulation. Finally, the thickness of the ice (and the overlying snow) regulates the light that reaches the surface ocean, fuelling the Southern Ocean food web. Scientists continue to untangle these interrelated processes, and it was great to be a part of it in Bern last week – thanks again to ISSI and to Petra Heil and Rachel Tilling for inviting me.